Task and Batch Monitoring with Prometheus and InfluxDB
This section describes how to monitor the applications that were deployed as part of a Task definition in Data Flow. The setup for each platform is different, but the general architecture is the same across the platforms.
The Data Flow metrics architecture is designed around the Micrometer library, which is a vendor-neutral application metrics facade. It provides a simple facade over the instrumentation clients for the most popular monitoring systems. See the Micrometer documentation for the list of supported monitoring systems. Micrometer is the instrumentation library that powers the delivery of application metrics from Spring Boot. Spring Batch provides additional integration to expose metrics around task durations, rates, and errors, which are critical to the monitoring of deployed batch-jobs.
We focus on using three time series databases: Wavefront, Prometheus, and InfluxDB.
Wavefront is a high-performance streaming analytics platform that supports 3D observability (metrics, histograms, and traces and spans). It scales to very high data ingestion rates and query loads while also collecting data from many services and sources across your entire application stack.
Prometheus is a popular pull-based time series database that pulls the metrics from the target applications with pre-configured endpoints and provides a query language to select and aggregate time series data in real time.
InfluxDB is a popular open-source push-based time series database. It supports downsampling, automatically expiring and deleting unwanted data, and backup and restore. Analysis of data is done through an SQL-like query language.
The core of the Micrometer task integration is part of the Spring Cloud Task’s 2.2.0 release line, which is a prerequisite for the Task metrics and the Data Flow integration. You can configure task applications built on the Spring Cloud Task 2.2+ version to emit Task and Batch metrics to the pre-configured monitoring systems supported by Micrometer.
Enable Task Metrics
To enable Task metrics integration with Data Flow, you must add the spring-boot-starter-actuator to your task application and import the spring-cloud-dependencies BOM, as follows:
<dependencies>
  <dependency>
      <groupId>org.springframework.boot</groupId>
      <artifactId>spring-boot-starter-actuator</artifactId>
  </dependency>
</dependencies>

<dependencyManagement>
	<dependencies>
		<dependency>
			<groupId>org.springframework.cloud</groupId>
			<artifactId>spring-cloud-dependencies</artifactId>
			<version>Hoxton.SR6</version>
			<type>pom</type>
			<scope>import</scope>
		</dependency>
	</dependencies>
</dependencyManagement>
Then you need to include the desired Micrometer registry as the dependency in the Task POM:
Enable Prometheus metrics collection by using RSocket with the following dependency:
<dependency>
	<groupId>io.micrometer.prometheus</groupId>
	<artifactId>prometheus-rsocket-spring</artifactId>
</dependency>
Enable Wavefront metrics collection by adding the micrometer-registry-wavefront dependency:
<dependency>
    <groupId>io.micrometer</groupId>
    <artifactId>micrometer-registry-wavefront</artifactId>
</dependency>

<dependency>
    <groupId>com.wavefront</groupId>
    <artifactId>wavefront-sdk-java</artifactId>
</dependency>
For Micrometer version 1.5.3 or newer, the wavefront-sdk-java dependency must be dropped.
Enable the InfluxDB metrics collection by adding the following dependency:
<dependency>
    <groupId>io.micrometer</groupId>
    <artifactId>micrometer-registry-influx</artifactId>
</dependency>
Build Docker Image
To build a Docker image, you could extend from the springcloud/openjdk:latest base-image. For example, your task Dockerfile could start like this:
FROM springcloud/openjdk:latest
...
To help you get started monitoring tasks, Data Flow provides Grafana dashboards that you can install and customize for your needs.
The following image shows the general architecture of how task applications are monitored:
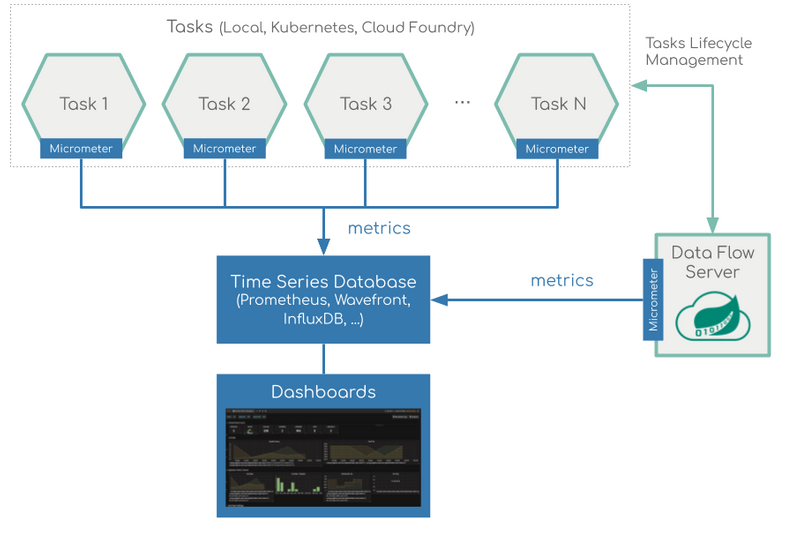
Prometheus requires a Service Discovery component to automatically probe the configured endpoint for metrics. The Spring Cloud Data Flow server uses the Prometheus RSocket Proxy, which uses the rsocket protocol for the service-discovery mechanism. The RSocket Proxy approach is used so that we can monitor tasks (which are short lived) and long-lived stream applications by using the same architecture. See the micrometer documentation on short-lived task and batch applications for more information. In addition, the RSocket approach lets the same monitoring architecture be used across all the platforms. Prometheus is configured to scrape each proxy instance. Proxies, in turn, use the RSocket connection to pull metrics from each application. The scraped metrics are then viewable through Grafana dashboards.
Spring Cloud Task Metric Tags
To allow aggregating metrics per application type and per instance ID or per task name, the Spring Cloud Task applications are configured to use the following Micrometer tags:
task.name: The name of the Task that contains the applications that send the metrics.task.execution.id: The instance ID of the executed task.task.external.execution.id: The external Task ID, as present on the target platform (such as Cloud Foundry or Kubernetes) The type (Source, Processor, or Sink) of the application that reports the metrics.task.parent.execution.id: The parent task ID used to identify task that executes another task or tasks.
If the Data Flow server is started with the spring.cloud.dataflow.metrics.dashboard.url property pointing to your Grafana URL, the Grafana feature is enabled and the Data Flow UI provides you with Grafana buttons that can open a particular dashboard for a given task.
Installing Wavefront, Prometheus, and InfluxDB differs, depending on the platform on which you run. Links to installation instructions are provides in each of the following sections.
Local
This section describes how to view application metrics for tasks by using either Prometheus or InfluxDB as the metrics store on your local machine.
Prometheus
To install Prometheus and Grafana, follow the Monitoring with Prometheus and Grafana Docker Compose instructions. Doing so brings up Spring Cloud Data Flow, Skipper, Apache Kafka, Prometheus, and prebuilt dashboards for Grafana.
Once all the containers are running, you can access the Spring Cloud Data Flow Dashboard at http://localhost:9393/dashboard.
You can also reach the Prometheus UI at http://localhost:9090/graph and http://localhost:9090/targets.
You can access the Grafana dashboard at http://localhost:3000 by using the following credentials:
- user:
admin - password:
admin
Now you can deploy a custom Task application (task-demo-metrics) and define two tasks (task1 and task2):
dataflow:>app register --name myTask --type task --uri https://raw.githubusercontent.com/spring-cloud/spring-cloud-dataflow-samples/master/dataflow-website/feature-guides/batch/monitoring/prometheus-task-demo-metrics-0.0.1-SNAPSHOT.jar

dataflow:>task create --name task1 --definition "myTask"
dataflow:>task create --name task2 --definition "myTask"
Then you can launch the tasks several times:
dataflow:>task launch --name task1
dataflow:>task launch --name task2
In the DataFlow task execution UI, you should see the following:

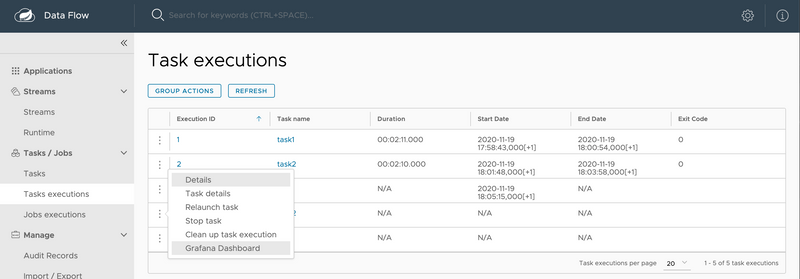
Also, in the Grafana dashboard for Tasks, you should see the following:
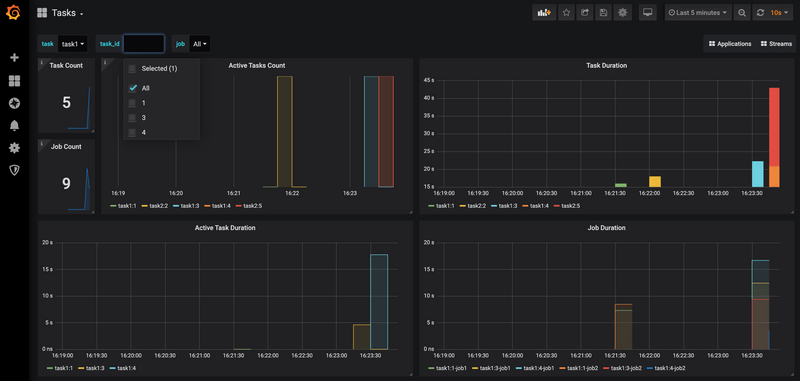
Wavefront
To install Data Flow with Wavefront support, follow the Monitoring with Wavefront Docker Compose instructions. Doing so brings up Spring Cloud Data Flow, Skipper, and Apache Kafka. It also points to the Wavefront's Data Flow Integration Tile automatically.
The Wavefront is a SaaS offering. You need to create a user account first and use it to set the WAVEFRONT_KEY and WAVEFRONT_URI environment variables as explained below.
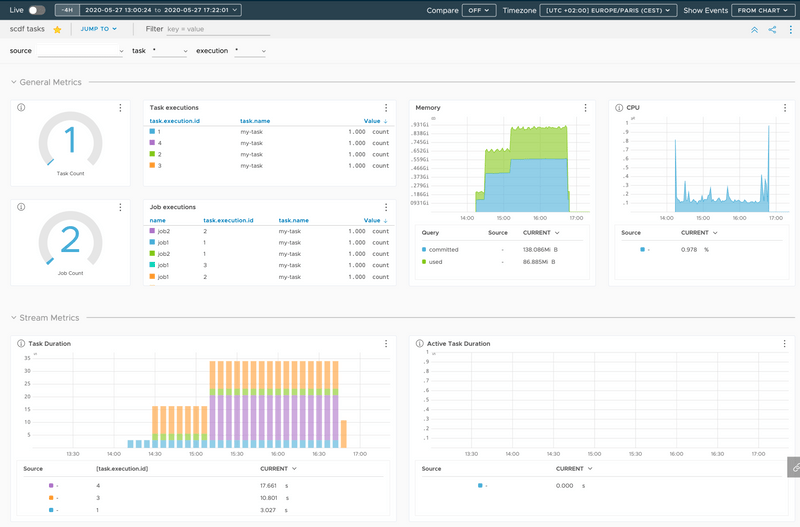
You should see dashboards similar to those shown in the following image:
InfluxDB
To install InfluxDB and Grafana, follow the Monitoring with InfluxDB and Grafana Docker Compose instructions. Doing so brings up Spring Cloud Data Flow, Skipper, Apache Kafka, InfluxDB, and prebuilt dashboards for Grafana.
Once all the containers are running, you can access the Spring Cloud Data Flow Dashboard at http://localhost:9393/dashboard. You can access the Grafana dashboard at http://localhost:3000 by using the following credentials:
- user:
admin - password:
admin
Now you can deploy a custom Task application (task-demo-metrics) and define two tasks (task1 and task2):
dataflow:>app register --name myTask --type task --uri https://raw.githubusercontent.com/spring-cloud/spring-cloud-dataflow-samples/master/dataflow-website/feature-guides/batch/monitoring/influx-task-demo-metrics-0.0.1-SNAPSHOT.jar

dataflow:>task create --name task1 --definition "myTask"
dataflow:>task create --name task2 --definition "myTask"
Then you can launch the tasks several times:
dataflow:>task launch --name task1
dataflow:>task launch --name task2
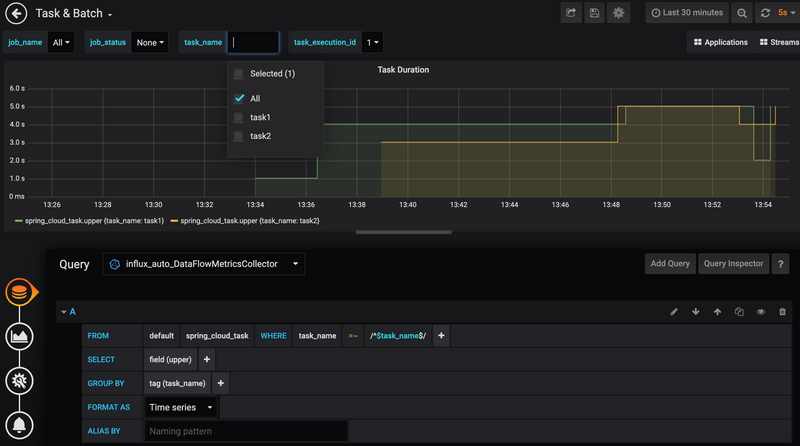
In the DataFlow task execution UI, you should see list like this:


You should see dashboards similar to those shown in the following image:
Kubernetes
This section describes how to view application metrics for task by using Prometheus or InfluxDB as the metrics store on Kubernetes.
Prometheus
To install Prometheus and Grafana on Kubernetes, you need to follow the instructions for a kubectl-based installation.
The address used to access the Grafana Dashboard depends on the Kubernetes platform the system is deployed to. If you are using (for example) GKE, the load balancer address would be used. If you use Minikube (which does not provide a load balancer implementation), the IP of the Minikube (along with an assigned port) is used. In the following examples, for simplicity, we use Minikube.
To obtain the URL of the Grafana UI when it is deployed to Minikube, run the following command:
$ minikube service --url grafana
http://192.168.99.100:31595
In the preceding example, you can reach the Grafana dashboard at http://192.168.99.100:31595. The default credentials are as follows:
- User name: admin
- Password: password
The Grafana instance is pre-provisioned with a dashboard:
You can collect metrics on a per-task or per-batch basis or globally apply metrics collection to all deployed applications.
We can use a custom Task application (task-demo-metrics) and define two different task definitions (task1 and task2) with this application :
dataflow:>app register --name myTask --type task --uri docker://springcloud/task-demo-metrics:latest

dataflow:>task create --name task1 --definition "myTask"
dataflow:>task create --name task2 --definition "myTask"
Then you can launch the tasks several times:
dataflow:>task launch --name task1
dataflow:>task launch --name task2
dataflow:>task launch --name task1
dataflow:>task launch --name task2
dataflow:>task launch --name task1
dataflow:>task launch --name task2
To obtain the SCDF URL when it is deployed to Minikube, run the following command:
minikube service --url scdf-server
http://192.168.99.100:32121
In the DataFlow task execution UI, you should see the following:


Open the Grafana dashboard for Tasks. You should see the following:

Wavefront
Wavefront is a SaaS offering. You need to create a user account first and obtain the API-KEY and WAVEFRONT-URI assigned to your account.
Follow the general Data Flow Kubernetes installation instructions.
Then add the following properties to your Spring Cloud Data Flow server configuration (for example, src/kubernetes/server/server-config.yaml) to enable the Wavefront Integration:
management:
  metrics:
    export:
      wavefront:
        enabled: true
        api-token: <YOUR API-KEY>
        uri: <YOUR WAVEFRONT-URI>
        source: demo-scdf-source
Then, in the Wavefront portal, you should see dashboards similar to those shown in the following image:

Cloud Foundry
This section describes how to view application metrics for streams by using Prometheus and InfluxDB as the metrics store on Cloud Foundry.
Prometheus
To configure the Data Flow server's manifest to send metrics data from stream applications to the Prometheus RSocket gateway, follow the Manifest-based installation instructions.
With Prometheus, Grafana, Spring Cloud Data Flow, and any other services (as defined in the Getting Started - Cloud Foundry section) running, you are ready to collect metrics.
Depending on where you have installed Grafana, you can access the Grafana dashboard by using the credentials:
- User name: admin
- Password: password
You must provision Grafana with following task dashboards: scdf-task-batch.json
Now you can deploy a custom Task application (task-demo-metrics) and define two tasks (task1 and task2):
dataflow:>app register --name myTask --type task --uri https://raw.githubusercontent.com/spring-cloud/spring-cloud-dataflow-samples/master/dataflow-website/feature-guides/batch/monitoring/prometheus-task-demo-metrics-0.0.1-SNAPSHOT.jar

dataflow:>task create --name task1 --definition "myTask"
dataflow:>task create --name task2 --definition "myTask"
You can launch the tasks several times:
dataflow:>task launch --name task1
dataflow:>task launch --name task2
In the DataFlow task execution UI, you should see the following:


Also, in the Grafana dashboard for Tasks, you should see the following:

Wavefront
Wavefront is a SaaS offering. You need to create a user account first and obtain the API-KEY and WAVEFRONT-URI assigned to your account.
To configure the Data Flow Server to send metrics data from stream applications to the Wavefront monitoring system, follow the Manifest-based Wavefront configuration instructions.
Then, in the Wavefront portal, you should see dashboards similar to those shown in the following image:

InfluxDB
You can follow the general Manifest-based installation on Cloud Foundry instructions for installing Skipper and DataFlow on Cloud Foundry.
To enable the Task metrics integration, follow the Configuration for InfluxDB instructions.