Scale-out a streaming pipeline with SCDF shell
To learn about the basic scaling concepts in Spring Cloud Data Flow, see the Scaling guide.
Overview
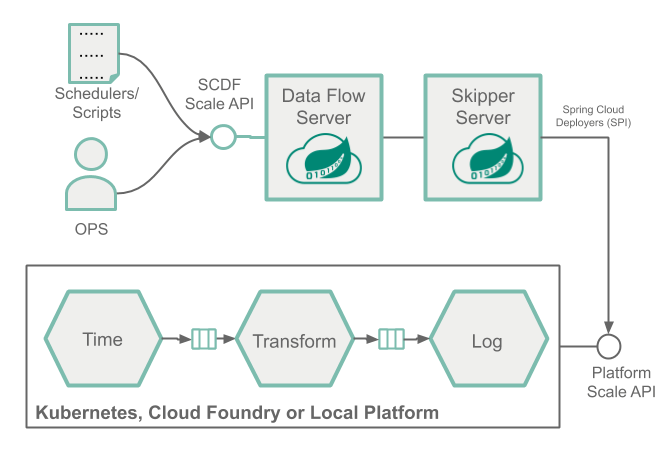
We deploy a streaming data pipeline, simulate a resource strangling scenario (for example, a high CPU spike), and use the SCDF shell to manually increase the number of consumer application instances to handle the increased load, as the following image shows:

This manual approach lets operators and developers intervene and scale out when they observe high load in a given application. For example, a retail store may want to design a system that can scale out upfront to meet the high load and demanding days, such as Black Friday.
When a more sophisticated approach is required to control the scale-out and scale-in operations in an automated manner, with the help of SCDF's monitoring support using Prometheus, you can configure and set up autoscaling rules. See the Autoscale streaming data pipelines with SCDF and Prometheus recipe to learn how to do this.
Prerequisite
This recipe uses the Kubernetes platform. Follow the Kubectl or the Helm installation instructions to setup Spring Cloud Data Flow with Kafka broker. Then run the following commands:
helm install --name my-release stable/spring-cloud-data-flow --set kafka.enabled=true,rabbitmq.enabled=false,kafka.persistence.size=10GiThen register the latest kafka-docker app starters.
Then start a SCDF Shell and connect it to your Data Flow Server:
server-unknown:>dataflow config server http://<SCDF IP>Scaling Recipe
This section shows a recipe for scaling an application.
Create a Data Pipeline
To create a data pipeline, run the following command:
stream create --name scaletest --definition "time --fixed-delay=995 --time-unit=MILLISECONDS | transform --expression=\"payload + '-' + T(java.lang.Math).exp(700)\" | log"The time source generates current timestamp messages on a fixed time-interval (995ms = ~1 msg/s), the transform processor performs a math operation to simulate high CPU processing, and the log sink prints the transformed message payload.
Deploy a Data Pipeline with Data Partitioning
To deploy a data pipeline with data partioning, run the following command:
stream deploy --name scaletest --properties "app.time.producer.partitionKeyExpression=payload,app.transform.spring.cloud.stream.kafka.binder.autoAddPartitions=true,app.transform.spring.cloud.stream.kafka.binder.minPartitionCount=4"The producer.partitionKeyExpression=payload property configures the time output binding for partitioning. The partition key expression uses the message payload (for example, the toString() value of the current timestamp) to compute how the data needs to be partitioned to the downstream output channels.
The spring.cloud.stream.kafka.binder.autoAddPartitions deployment property instructs the Kafka binder to create new partitions when required. This is required if the topic is not already over-partitioned.
The spring.cloud.stream.kafka.binder.minPartitionCount property sets the minimum number of partitions that the Kafka binder configures on the topic, which is where the transform-processor is subscribing for new data.
Once the scaletest stream is deployed you should see the following:


Singe application instances for each application.
Use the SCDF's built-in Grafana dashboard to review the stream application's throughput and the other application metrics:

The time, transform, and log applications maintain the same message throughput (~1 msg/s). The transform handles the current load.
Increase the Data Pipeline Load
Now we increase the load by increasing the time source's message production rate. By changing the time source's time-unit property from MILLISECONDS to MICROSECONDS, the input rate increase from one to thousands of messages per second.
Note that the stream rolling-update functionality lets you perform a rolling update of only the time application without stopping the entire stream:
stream update --name scaletest --properties "app.time.trigger.time-unit=MICROSECONDS"Now the time source emits messages with a rate of ~5000 msg/s. The transform processor, though, is capped at around 1000 msg/s. In turn, it halts the throughput of the entire stream to a certain level. This is an indicator that the transform has become the bottleneck, as the following image shows:

Scale-Out
Use the SCDF Shell to scale the transform instances to four:
stream scale app instances --name scaletest --applicationName transform --count 4As a result of the previous command, three additional transform instances are deployed, as the following images show:


With the help of the additional instances of the transform processor, the entire data pipeline catches up to match with the time source's production rate.

Decrease the Data Pipeline Load and Scale-In
Now we reduce the source's data production rate back to the original rate (1 msg/s):
stream update --name scaletest --properties "app.time.trigger.time-unit=MILLISECONDS"The extra transform processor instances no longer alter the overall throughput rate. These extra instances can be scaled back in (that is, removed), as follows:

Doing so lets us reduce the number of transform application instances to the original capacity. To reduce the number of instances, run the following command:
stream scale app instances --name scaletest --applicationName transform --count 1The following image shows the result:
