Monitoring
The Data Flow monitoring architecture helps to deliver application metrics critical to the health and performance of the server infrastructure and the deployed stream and task pipelines.
Designed around the Micrometer library, Data Flow monitoring supports some of the most popular monitoring systems, such as Prometheus, Wavefront, and InfluxDB.
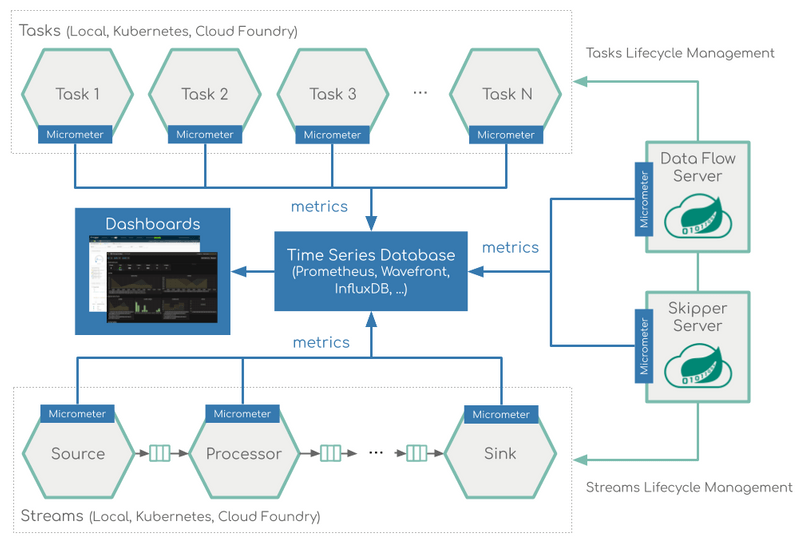
Wavefront is a high-performance streaming analytics platform that supports 3D observability (metrics, histograms, and traces and spans). It scales to very high data ingestion rates and query loads while also collecting data from many services and sources across your entire application stack.
Prometheus is a popular pull-based time series database that pulls the metrics from the target applications with pre-configured endpoints and provides a query language to select and aggregate time series data in real time.
The Data Flow architecture employs the Prometheus RSocket Proxy to provide uniform support of both long-lived (streams) and short-lived (tasks) applications.
InfluxDB is a popular open-source push-based Time Series Database. It supports downsampling, automatically expiring and deleting unwanted data, and backup and restore. Analysis of data is done through an SQL-like query language.
Data Flow lets you declaratively select and configure which monitoring system to use. To do so, you can apply the Spring Boot metrics configuration to enable and configure the Data Flow monitoring support. Usually, you add the following configurations to your Data Flow and Skipper server configurations:
management.metrics.export.<your-meter-registry>.enabled=true
management.metrics.export.<your-meter-registry>.<meter-specific-properties>=... - Replace the
<your-meter-registry>withinflux,wavefront, orprometheus. (Note: If you use Prometheus, enable the Prometheus Rsocket proxy as well:management.metrics.export.prometheus.rsocket.enabled=true). - Use the Spring Boot- and Micrometer-specific configurations provided for Wavefront, InfluxDB and Prometheus and RSocket Proxy.
By default, the Micrometer configuration is reused for both the server infrastructure and the data pipeline monitoring.
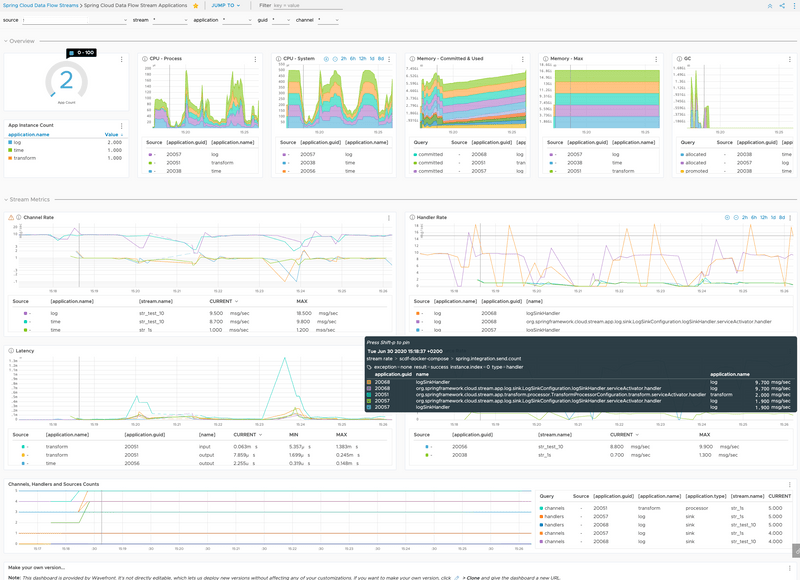
To help you get started, Data Flow provides Grafana and Wavefront dashboards that you can customize.
You can also opt for the Wavefront Data Flow SaaS tile.
For detailed information on how to set up the monitoring infrastructure, see the following feature guides:
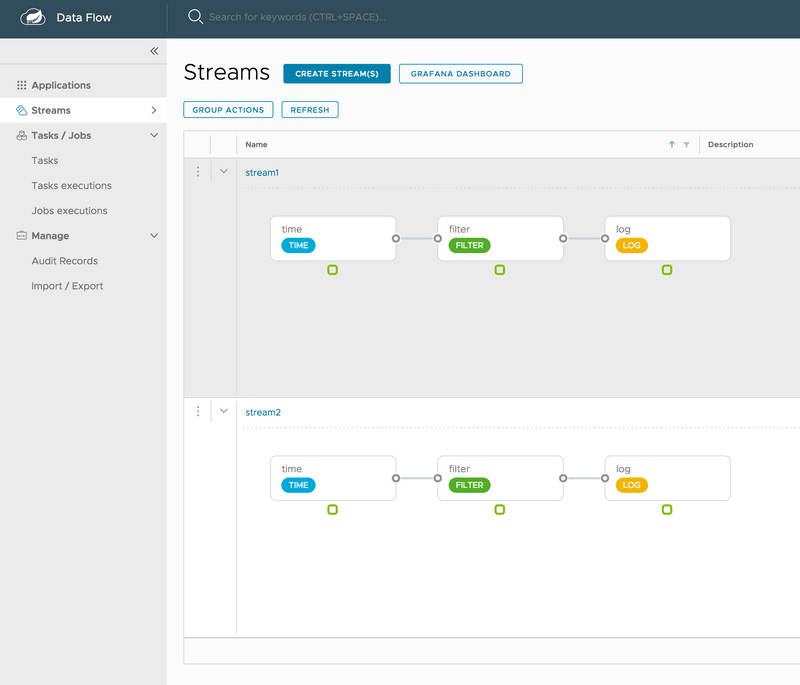
The following image shows Data Flow with enabled monitoring and Grafana buttons:
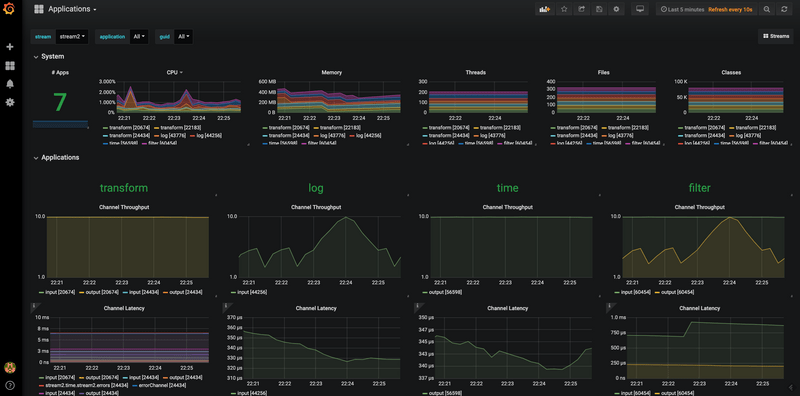
The following image shows the Stream applications view in the Grafana dashboard:
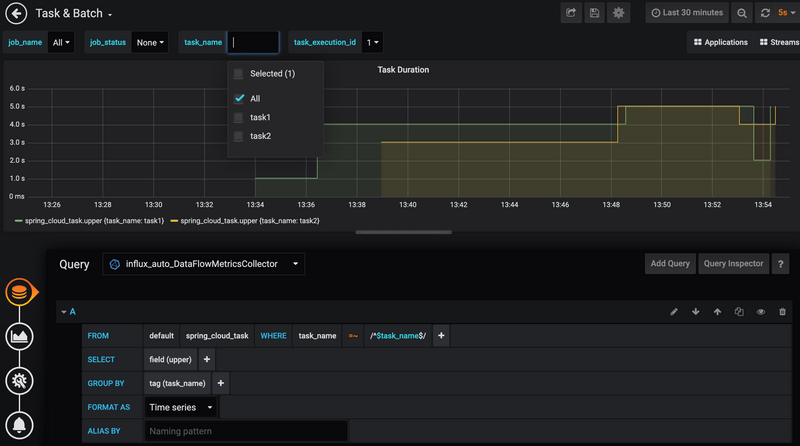
The following image shows the Tasks & Batch applications view in the Grafana dashboard:
The following image shows the Wavefront Stream applications dashboard:
Next, visit the Servers Monitoring Feature Guide, the Stream Monitoring Feature Guide and the Task Monitoring Feature Guide for further information on how to set up the Data Flow monitoring infrastructure.