Getting Started with Stream Processing
Spring Cloud Data Flow provides over 70 prebuilt streaming applications that you can use right away to implement common streaming use cases. In this guide, we use two of these applications to construct a simple data pipeline that produces data sent from an external HTTP request and consumes that data by logging the payload to the terminal.
The Installation guide includes instructions for registering these prebuilt applications with Data Flow.
Stream DSL overview
You can create streams by using a Domain Specific Language (DSL) through the shell or the dashboard as well as programmatically in Java. The dashboard also lets you drag and drop applications onto a palette and connect them visually. The dashboard is bi-directional, so visual actions update the DSL. Similarly, edits to the DSL update the view of the stream.
The DSL is modeled after the Unix pipes and filter syntax.
As an example, a stream DSL defined as http | log represents an http application sending the data it received from an HTTP post to the messaging middleware.
The log application receives the message with that data from the messaging middleware and logs it to the terminal.
Each name in the DSL is associated with an application through the application registration process.
The applications are connected through a | symbol that represents the messaging middleware, which acts as the "pipe" between the applications.
The following diagram shows the Stream processing life cycle:
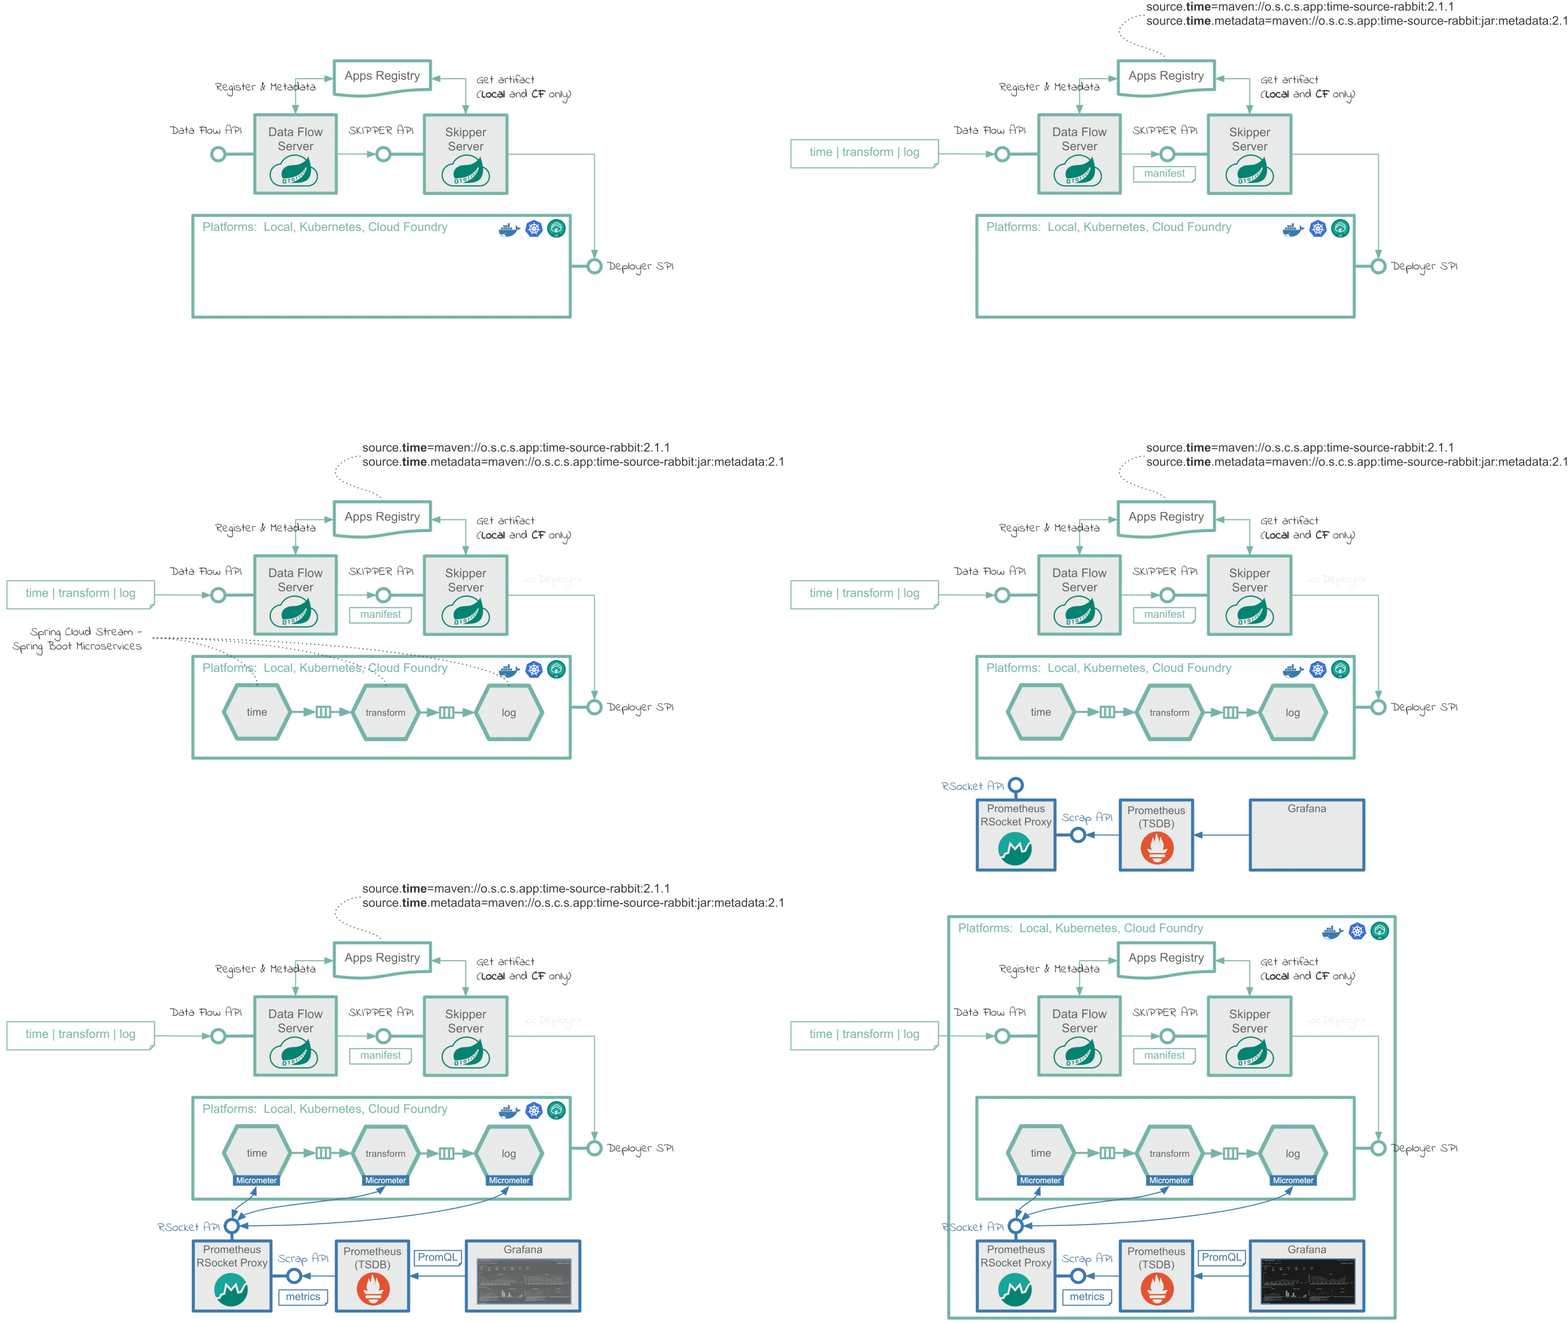
Creating the Stream
To create a stream:
- In the menu, click Streams.
-
Click the Create Stream(s) button.
The screen changes to the following image:
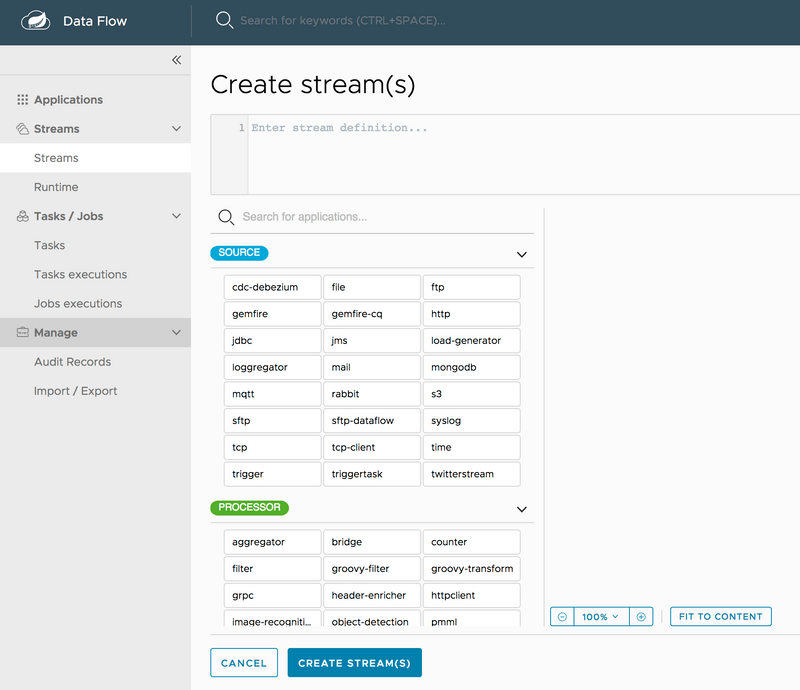
- In the text area, type
http | log. - Click Create Stream.
-
Enter
http-ingestfor the stream name, as follows: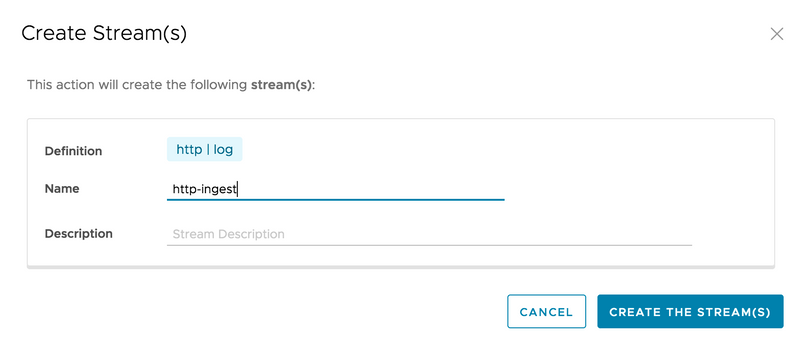
-
Click the Create the stream button.
The Definitions page appears.

Deploying a Stream
Now that you have defined a stream, you can deploy it. To do so:
-
Click the play (deploy) button next to the
http-ingestdefinition that you created in the previous section.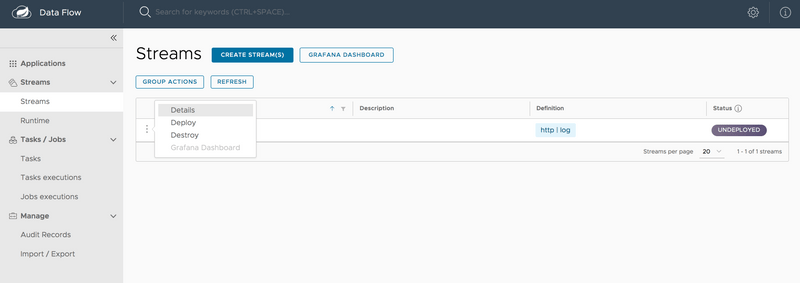
The UI shows the available properties that you can apply to the apps in the
http-ingeststream. This example shown in the following image uses the defaults: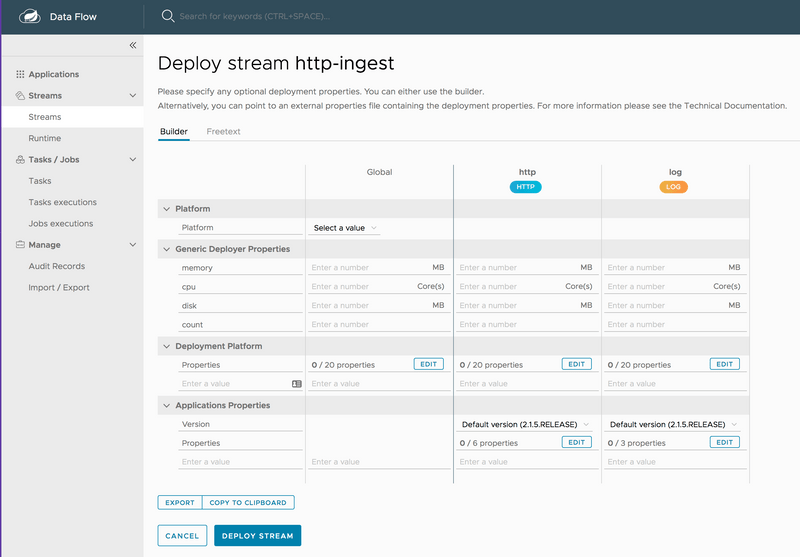
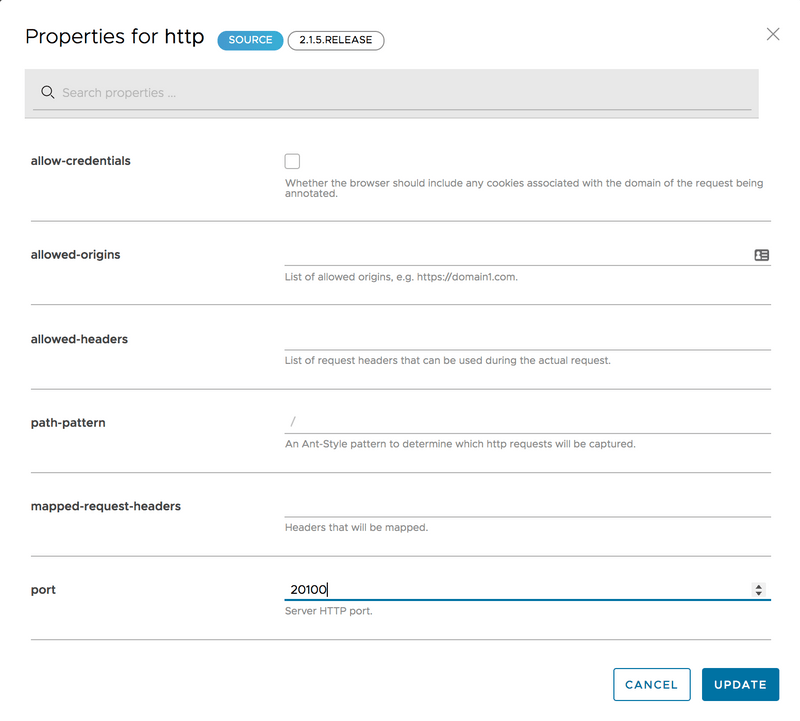
If you use the local Data Flow Server, add the following deployment property to set the port to avoid a port collision:
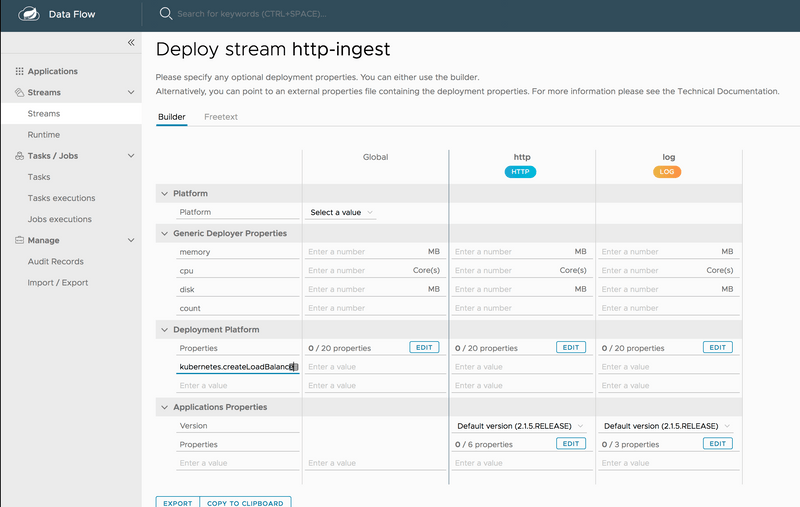
If deploying Spring Cloud Data Flow to Kubernetes, set the kubernetes.createLoadBalancer deployment property to true on the http source application to expose the service externally, as follows:
-
Click the Deploy Stream button.
The UI returns to the Definitions page.
The stream is now in
deployingstatus, and its status becomesdeployedwhen it has finished deploying. You may need to refresh your browser to see the updated status.
Verifying Output
Once your application is deployed, you can verify its output. How to do so depends on where you run your application:
Local
This section details how to verify output when your application runs on a local server.
Test Data
Once the stream is deployed and running, you can post some data. You can use the following curl command to do so:
curl http://localhost:20100 -H "Content-type: text/plain" -d "Happy streaming"Results
Once a stream is deployed, you can view its logs. To do so:
- Click Runtime in the menu.
- Click
http-ingest.log. - Copy the path in the
stdouttext box on the dashboard -
In another console window, type the following, replacing
/path/from/stdout/textbox/in/dashboardwith the value you copied in the previous step:docker exec -it skipper tail -f /path/from/stdout/textbox/in/dashboardThe output of the log sink appears in the new window. You should see the output shown below.
log-sink : Happy streamingWhen you have seen enough output from sending http requests, press Ctrl+C to end the tail command.
Cloud Foundry
This section details how to verify output when your application runs on Cloud Foundry.
Test Data
Once the stream is deployed and running in Cloud Foundry, you can post some data. You can use the following curl command to do so:
curl http://http-ingest-314-log-v1.cfapps.io -H "Content-type: text/plain" -d "Happy streaming"Results
Now you can list the running applications again and see your applications in the list, as follows:
cf apps                                                                                                                                                                                                                                         [1h] ✭
Getting apps in org ORG / space SPACE as [email protected]...

name                         requested state   instances   memory   disk   urls
http-ingest-314-log-v1       started           1/1         1G       1G     http-ingest-314-log-v1.cfapps.io
http-ingest-314-http-v1      started           1/1         1G       1G     http-ingest-314-http-v1.cfapps.io
skipper-server               started           1/1         1G       1G     skipper-server.cfapps.io
dataflow-server              started           1/1         1G       1G     dataflow-server.cfapps.io
Now you can verify the logs, as follows:
cf logs http-ingest-314-log-v1
...
...
2017-11-20T15:39:43.76-0800 [APP/PROC/WEB/0] OUT 2017-11-20 23:39:43.761  INFO 12 --- [ http-ingest-314.ingest-314-1] log-sink                                 : Happy streaming
Kubernetes
This section details how to verify output when your application runs on Kubernetes.
Get the HTTP service URL by running a command.
If deploying to a cluster that supports a load balancer, you can determine the HTTP service address by running the following command:
export SERVICE_URL="$(kubectl get svc --namespace default http-ingest-http-v1 -o jsonpath='{.status.loadBalancer.ingress[0].ip}'):8080"It may take a few minutes for the LoadBalancer IP to be available.
You can watch the status of the server by running kubectl get svc -w http-ingest-http-v1
If you use Minikube, you can use the following command to get the URL of the server:
export SERVICE_URL=$(minikube service --url test-http-v1)You can view the HTTP URL of the application by typing the following:
echo $SERVICE_URL
Test Data
Once the stream is deployed and running in Kubernetes, you can now post some data. You can use the following curl command to do so:
curl $SERVICE_URL -H "Content-type: text/plain" -d "Happy streaming"Results
The results should be similar to the following example:
kubectl get pods
NAME                              READY     STATUS    RESTARTS   AGE
http-ingest-log-v1-0-2k4r8          1/1       Running   0          2m
http-ingest-http-v1-qhdqq           1/1       Running   0          2m
mysql-777890292-z0dsw               1/1       Running   0          49m
rabbitmq-317767540-2qzrr            1/1       Running   0          49m
scdf-server-2734071167-bjd3g        1/1       Running   0          12m
skipper-2408247821-50z31            1/1       Running   0          15m
Now you can verify the logs, as follows:
kubectl logs -f http-ingest-log-v1-0-2k4r8
...
...
2017-10-30 22:59:04.966  INFO 1 --- [ http-ingest.http.http-ingest-1] log-sink                                 : Happy streaming
Deleting a Stream
Now you can delete the stream you created. To do so:
- Click Streams in the menu.
- Click the down chevron on the
http-ingestrow. - Click Destroy Stream.
- When prompted for confirmation, click Destroy Stream Definition(s).
Updating and Rolling back a Stream
You can find this information in the Continuous Delivery guide.
Monitoring
You can find this information in the Stream Monitoring guide.