Local Deployment
If you have configured and built the sample stream applications and configured it to run with one of the supported message brokers, you can run them as stand-alone applications in your local environment.
If you have not already done so, you can either download and run Kafka in your local environment, or use docker-compose to run Kafka and Zookeeper as containers.
Install and Run Kafka
Download and unpack the archive. Then start the ZooKeeper and Kafka servers by running the following commands from the Kafka install directory:
./bin/zookeeper-server-start.sh config/zookeeper.properties &./bin/kafka-server-start.sh config/server.properties &Run with Docker Compose
Alternately, you can download the trial Confluent platform for Docker
curl --silent --output docker-compose.yml \
  https://raw.githubusercontent.com/confluentinc/cp-all-in-one/6.1.0-post/cp-all-in-one/docker-compose.yml
To start the platform:
docker-compose up -dIn addition to the Kafka broker, this installs other Confluent components, including Control Center. Access Control Center at http://localhost:9021 , and choose Topics to display messages published to the topics.
Running the Source
By using the pre-defined configuration properties for UsageDetailSender, you can run the application, as follows:
java -jar target/usage-detail-sender-kafka-0.0.1-SNAPSHOT.jar &If you installed Kafka binaries, you can see the messages being sent to the usage-detail Kafka topic by using the Kafka console consumer, as follows:
./bin/kafka-console-consumer.sh --bootstrap-server localhost:9092 --topic usage-detailIf you have installed the Confluent platform, access Control Center, as described above. Select the usage-detail topic, and the Messages tab. You should see something like this:
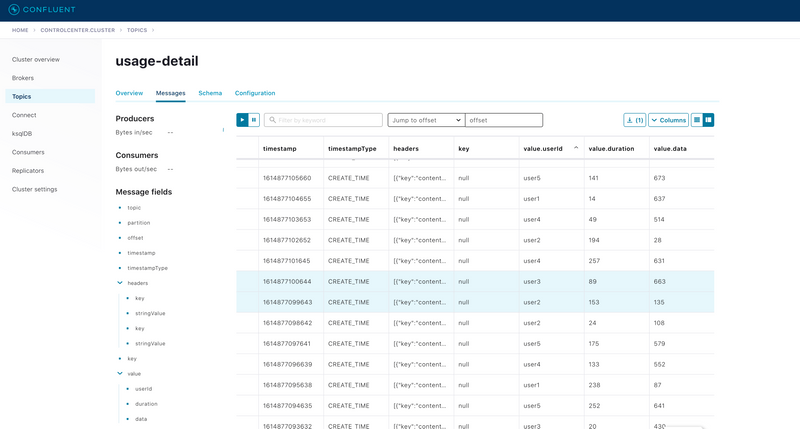
To list the topics, run the following command:
./bin/kafka-topics.sh --zookeeper localhost:2181 --listRunning the Processor
By using the pre-defined configuration properties for UsageCostProcessor, you can run the application, as follows:
java -jar target/usage-cost-processor-kafka-0.0.1-SNAPSHOT.jar &With the UsageDetail data in the usage-detail Kafka topic from the UsageDetailSender source application, you can see the UsageCostDetail from the usage-cost Kafka topic, as follows:
./bin/kafka-console-consumer.sh --bootstrap-server localhost:9092 --topic usage-costOr, using the Control Center:
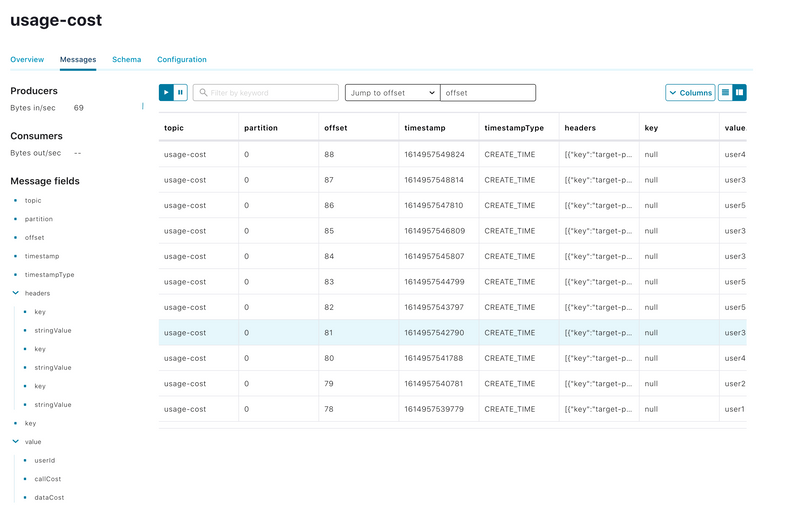
Running the Sink
By using the pre-defined configuration properties for UsageCostLogger, you can run the application, as follows:
java -jar target/usage-cost-logger-kafka-0.0.1-SNAPSHOT.jar &Now you can see that this application logs the usage cost detail.
...
2021-03-05 10:44:05.193  INFO 55690 --- [container-0-C-1] i.s.d.s.u.UsageCostLogger     : {"userId": "user2", "callCost": "0.7000000000000001", "dataCost": "21.8" }
2021-03-05 10:44:05.193  INFO 55690 --- [container-0-C-1] i.s.d.s.u.UsageCostLogger     : {"userId": "user2", "callCost": "0.7000000000000001", "dataCost": "21.8" }
2021-03-05 10:44:06.195  INFO 55690 --- [container-0-C-1] i.s.d.s.u.UsageCostLogger     : {"userId": "user4", "callCost": "0.5", "dataCost": "24.55" }
2021-03-05 10:44:06.199  INFO 55690 --- [container-0-C-1] i.s.d.s.u.UsageCostLogger     : {"userId": "user4", "callCost": "0.5", "dataCost": "24.55" }
...
Clean up
If you started the Confluent platform with docker-compose, to clean up:
docker-compose stopLocal Deployment using RabbitMQ
If you have configured and built the sample stream applications to run with RabbitMQ, You can run the applications as stand-alone applications in your local environment.
Install and Run RabbitMQ
To install and run the RabbitMQ docker image, run the following command:
docker run -d --hostname rabbitmq --name rabbitmq -p 15672:15672 -p 5672:5672 rabbitmq:3.7.14-managementOnce installed, you can log in to the RabbitMQ management console on your local machine on http://localhost:15672.
You can use the default account username and password: guest and guest.
Running the UsageDetailSender Source
By using the pre-defined configuration properties for UsageDetailSender, you can run the application, as follows:
java -jar target/usage-detail-sender-rabbit-0.0.1-SNAPSHOT.jar &When this application is running, you can see that the usage-detail RabbitMQ exchange is created and that the queue named usage-detail.usage-cost-consumer is bound to this exchange, as follows:
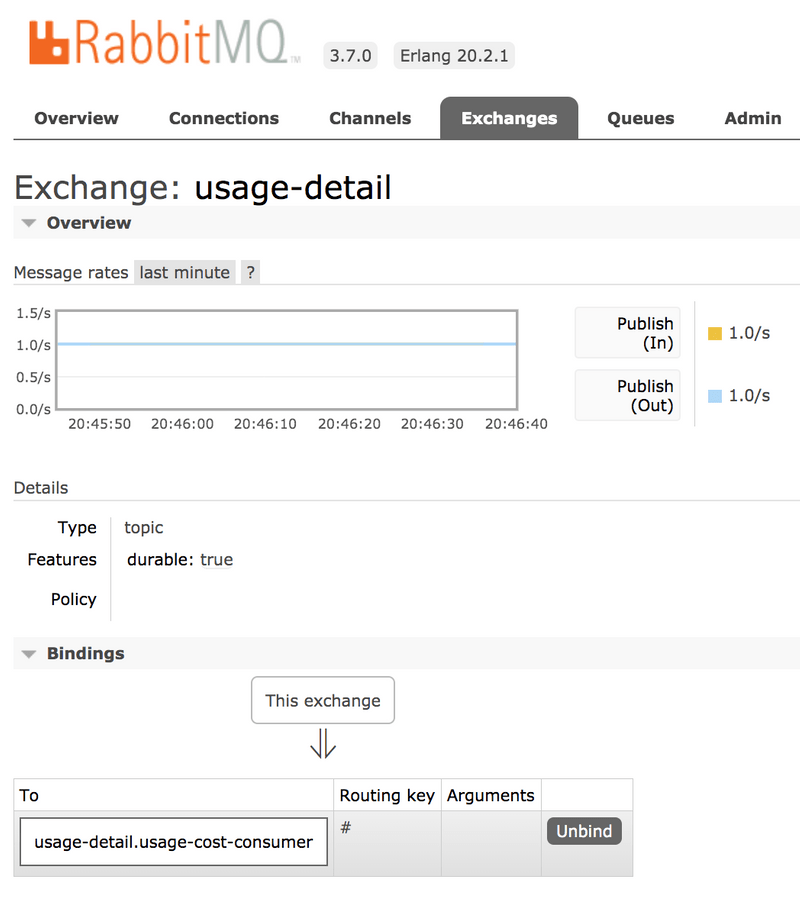
Also, if you click on the Queues and check the queue usage-detail.usage-cost-consumer, you can see the messages being consumed and stored in this durable queue, as follows:
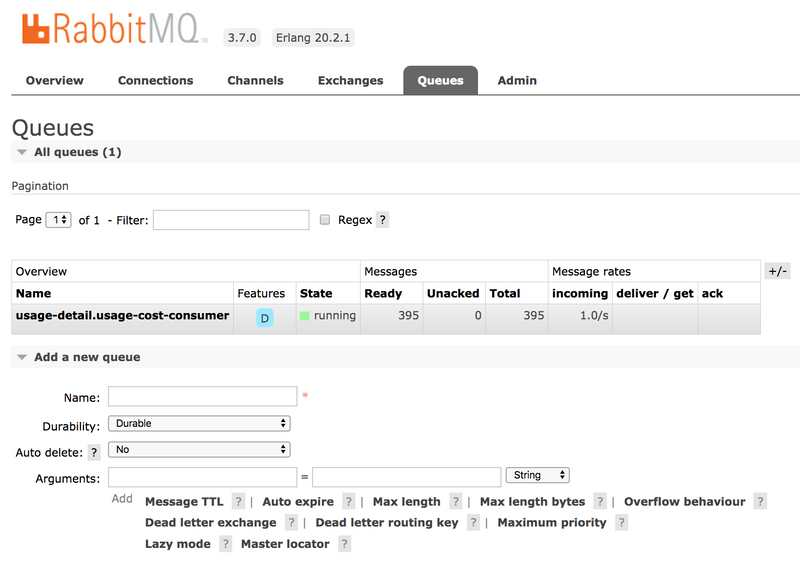
When configuring the consumer applications for this Source application, you can set the group binding property to connect to the corresponding durable queue.
If you do not set the requiredGroups property, you can see that there is no queue for consuming the messages from the usage-detail exchange and, therefore, the messages are lost if the consumer is not up before this application is started.
Running the Processor
By using the pre-defined configuration properties for UsageCostProcessor, you can run the application, as follows:
java -jar target/usage-cost-processor-rabbit-0.0.1-SNAPSHOT.jar &From the RabbitMQ console, you can see:
- The
UsageCostProcessorapplication consumes from theusage-detail.usage-cost-consumerdurable queue, based on thespring.cloud.stream.bindings.input.group=usage-cost-consumerproperty. - The
UsageCostProcessorapplication produces theUsageCostDetailand sends it to the exchangeusage-cost, based on thespring.cloud.stream.bindings.output.destination=usage-costproperty. - The
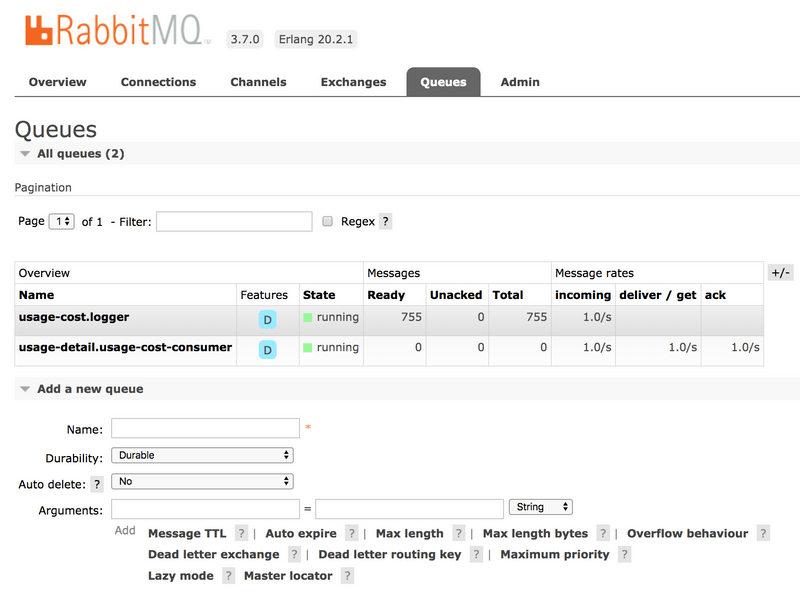
usage-cost.loggerdurable queue is created. It consumes the messages from theusage-costexchange, based on thespring.cloud.stream.bindings.output.producer.requiredGroups=loggerproperty.
When this application is running, you can see that the usage-cost RabbitMQ exchange is created and the durable queue named usage-cost.logger is bound to this exchange, as follows:
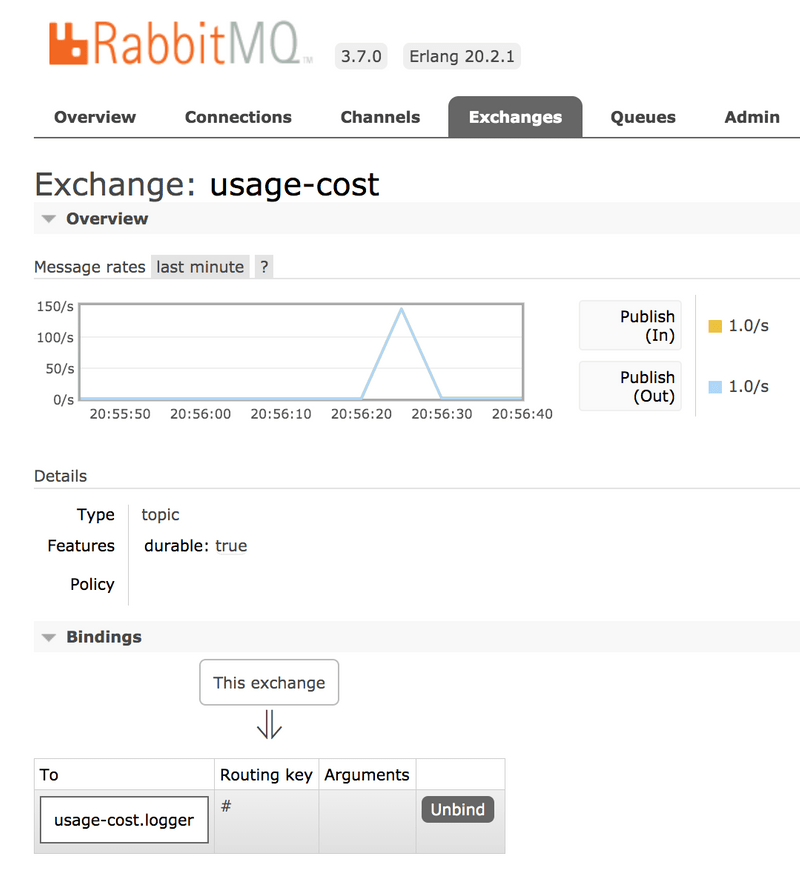
Also, if you click on the Queues and check the usage-cost.logger queue, you can see the messages being consumed and stored in this durable queue, as follows:
Running the Sink
By using the pre-defined configuration properties for UsageCostLogger, you can run the application, as follows:
java -jar target/usage-cost-logger-rabbit-0.0.1-SNAPSHOT.jar &Now you can see that this application logs the usage cost detail it receives from the usage-cost RabbitMQ exchange through the usage-cost.logger durable queue, as follows:
2019-05-08 08:16:46.442  INFO 10769 --- [o6VmGALOP_onw-1] i.s.d.s.u.UsageCostLogger     : {"userId": "user2", "callCost": "28.3", "dataCost": "29.8" }
2019-05-08 08:16:47.446  INFO 10769 --- [o6VmGALOP_onw-1] i.s.d.s.u.UsageCostLogger     : {"userId": "user2", "callCost": "12.0", "dataCost": "23.75" }
2019-05-08 08:16:48.451  INFO 10769 --- [o6VmGALOP_onw-1] i.s.d.s.u.UsageCostLogger     : {"userId": "user4", "callCost": "16.0", "dataCost": "30.05" }
2019-05-08 08:16:49.454  INFO 10769 --- [o6VmGALOP_onw-1] i.s.d.s.u.UsageCostLogger     : {"userId": "user1", "callCost": "17.7", "dataCost": "18.0" }