Stream Processing with Data Flow and RabbitMQ
This section shows how to register stream applications with Data Flow, create a Stream DSL, and deploy the stream to Cloud Foundry, Kubernetes, and your local machine.
In the previous guides, we created Source, Processor and Sink streaming applications and deployed them as standalone applications on multiple platforms.
In this guide, we register these applications with Data Flow, create a Stream DSL, and deploy the stream to Cloud Foundry, Kubernetes, and your local machine.
Development
All the sample applications from the previous guide are available as maven and docker artifacts at the https://repo.spring.io Maven repository.
For the UsageDetailSender source, use one of the following:
maven://io.spring.dataflow.sample:usage-detail-sender-rabbit:0.0.1-SNAPSHOTdocker://springcloudstream/usage-detail-sender-rabbit:0.0.1-SNAPSHOTFor the UsageCostProcessor processor, use one of the following:
maven://io.spring.dataflow.sample:usage-cost-processor-rabbit:0.0.1-SNAPSHOTdocker://springcloudstream/usage-cost-processor-rabbit:0.0.1-SNAPSHOTFor the UsageCostLogger sink, use one of the following:
maven://io.spring.dataflow.sample:usage-cost-logger-rabbit:0.0.1-SNAPSHOTdocker://springcloudstream/usage-cost-logger-rabbit:0.0.1-SNAPSHOTThe Data Flow Dashboard
Assuming Data Flow is installed and running on one of the supported platforms, open your browser at <data-flow-url>/dashboard. Here, <data-flow-url> depends on the platform. See the installation guide to determining the base URL for your installation. If Data Flow is running on your local machine, go to http://localhost:9393/dashboard.
Application Registration
Applications in Spring Cloud Data Flow are registered as named resources so that they may be referenced when you use the Data Flow DSL to configure and compose streaming pipelines. Registration associates a logical application name and type with a physical resource, which is given by a URI.
The URI conforms to a schema and may represent a Maven artifact, a Docker image, or an actual http(s) or file URL. Data Flow defines some logical application types to indicate its role as a streaming component, a task, or a standalone application. For streaming applications, as you might expect, we use Source,Processor, and Sink types.
The Data Flow Dashboard lands on the Application Registration view, where we can register the source, processor, and sink applications, as follows:

In this step, we register the applications we previously created. When you register an application, you provide its:
- Location URI (Maven, HTTP, Docker, file, and so on)
- Application version
- Application type (source, processor, or sink)
- Application name
The following table shows the applications we created in the previous guides:
| App Name | App Type | App URI |
|---|---|---|
usage-detail-sender |
Source | maven://io.spring.dataflow.sample:usage-detail-sender-rabbit:0.0.1-SNAPSHOT |
usage-cost-processor |
Processor | maven://io.spring.dataflow.sample:usage-cost-processor-rabbit:0.0.1-SNAPSHOT |
usage-cost-logger |
Sink | maven://io.spring.dataflow.sample:usage-cost-logger-rabbit:0.0.1-SNAPSHOT |
If you run the Spring Cloud Data Flow server on the Docker environment, make sure that your application artifact URIs are accessible.
For instance, you may not be able to access file:/ from SCDF or Skipper Docker containers unless you have made the application locations be
accessible. We recommend using http://, maven:// or docker:// for application URIs.
For this example, assume you run Spring Cloud Data Flow and Skipper servers on your local development environment.
You can register the UsageDetailSender source application. To do so:
- From the Applications view, select ADD APPLICATION(S). This shows a view that lets you register applications.
- Select Register one or more applications and enter the
name,type, andURIfor the source application. -
Register the
mavenartifact of theUsageDetailSenderapplication namedusage-detail-sender, as follows:(uri =
maven://io.spring.dataflow.sample:usage-detail-sender-rabbit:0.0.1-SNAPSHOT)If you use a
dockerartifact, then register it using the URI:(uri =
docker://springcloudstream/usage-detail-sender-rabbit:0.0.1-SNAPSHOT) - Click on NEW APPLICATION to display another instance of the form to enter the values for the processor.
-
Register the
mavenartifact of theUsageCostProcessorprocessor application namedusage-cost-processor, as follows:(uri =
maven://io.spring.dataflow.sample:usage-cost-processor-rabbit:0.0.1-SNAPSHOT)If you use a
dockerartifact, then register it using the URI:(uri =
docker://springcloudstream/usage-cost-processor-rabbit:0.0.1-SNAPSHOT) - Click on NEW APPLICATION to display another instance of the form to enter the values for the sink.
-
Register the
mavenartifact of theUsageCostLoggersink application namedusage-cost-logger, as follows:(uri =
maven://io.spring.dataflow.sample:usage-cost-logger-rabbit:0.0.1-SNAPSHOT)If you use a
dockerartifact, then register it using the URI:(uri =
docker://springcloudstream/usage-cost-logger-rabbit:0.0.1-SNAPSHOT)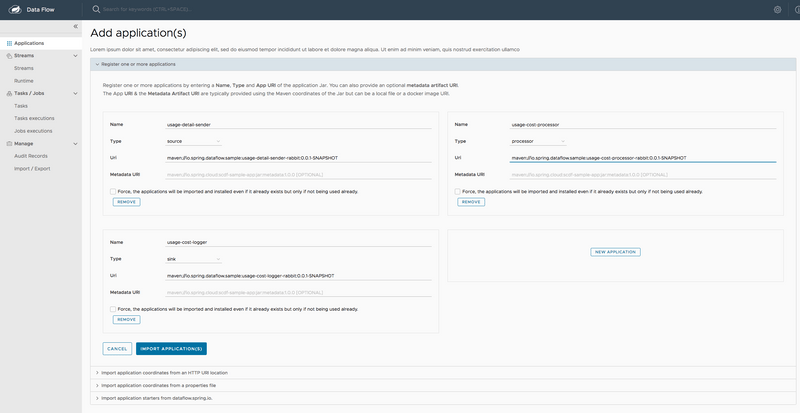
-
Click on IMPORT APPLICATION(S) to complete the registration. Doing so takes you back to the Applications view, which lists your applications. The following image shows an example:

Creating the Stream Definition
To create the stream definition:
-
Select Streams from the left navigation bar. This shows the main Streams view, as follows:

-
Select Create stream(s) to display a graphical editor to create the stream definition, as the following image shows:
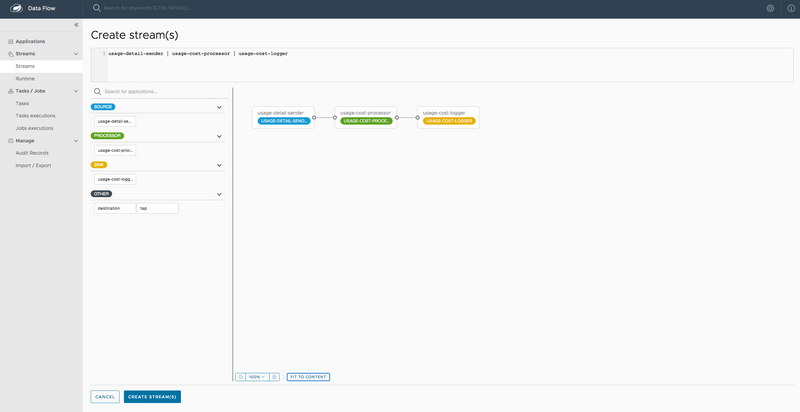
You can see the
Source,ProcessorandSinkapplications, as registered above, in the left panel. - Drag and drop each application to the canvas and then use the handles to connect them together. Notice the equivalent Data Flow DSL definition in the top text panel.
-
Click
Create Stream.You can type the name of the stream
usage-cost-loggerwhen creating the stream.
Deployment
To deploy your stream,
- Click on the arrow head icon to deploy the stream. Doing so takes you to the Deploy Stream page, where you may enter additional deployment properties.
-
Select
Deploy, as follows: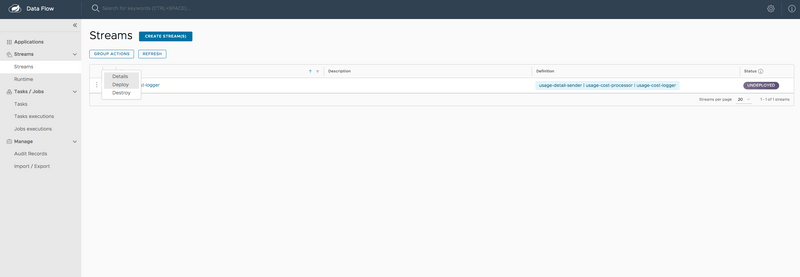
-
When deploying the stream, choose the target platform accounts from local, Kubernetes, or Cloud Foundry. This is based on the Spring Cloud Skipper server deployer platform account setup.
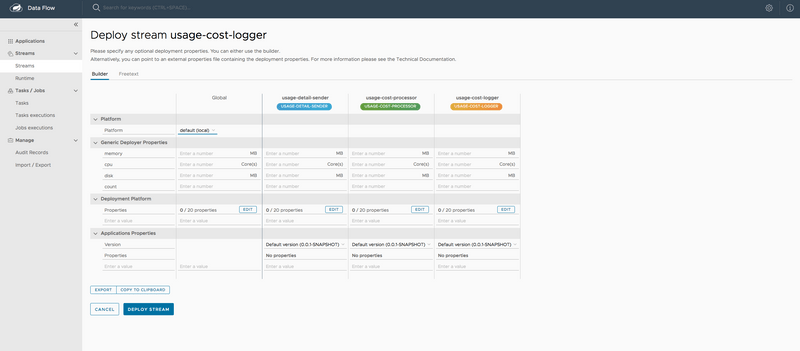
When all the applications are running, the stream is successfully deployed.

The preceding process is basically the same for all platforms. The following sections addresses platform-specific details for deploying on Data Flow on Local, Cloud Foundry, and Kubernetes.
Local
If you deploy the stream on the local environment, you need to set a unique value for the server.port application property for each application so that they can use different ports on local.
Once the stream is deployed on the local development environment, you can look at the runtime applications by using the dashboard's runtime page or by using the SCDF shell command, runtime apps.
The runtime applications show information about where each application runs in the local environment and their log files locations.
If you run SCDF on Docker, to access the log files of the streaming applications, you can run the following command (shown with its output):
docker exec <stream-application-docker-container-id> tail -f <stream-application-log-file>
2019-04-19 22:16:04.864  INFO 95238 --- [container-0-C-1] c.e.demo.UsageCostLoggerApplication      : {"userId": "Mark", "callCost": "0.17", "dataCost": "0.32800000000000007" }
2019-04-19 22:16:04.872  INFO 95238 --- [container-0-C-1] c.e.demo.UsageCostLoggerApplication      : {"userId": "Janne", "callCost": "0.20800000000000002", "dataCost": "0.298" }
2019-04-19 22:16:04.872  INFO 95238 --- [container-0-C-1] c.e.demo.UsageCostLoggerApplication      : {"userId": "Ilaya", "callCost": "0.175", "dataCost": "0.16150000000000003" }
2019-04-19 22:16:04.872  INFO 95238 --- [container-0-C-1] c.e.demo.UsageCostLoggerApplication      : {"userId": "Glenn", "callCost": "0.145", "dataCost": "0.269" }
2019-04-19 22:16:05.256  INFO 95238 --- [container-0-C-1] c.e.demo.UsageCostLoggerApplication      : {"userId": "Ilaya", "callCost": "0.083", "dataCost": "0.23800000000000002" }
2019-04-19 22:16:06.257  INFO 95238 --- [container-0-C-1] c.e.demo.UsageCostLoggerApplication      : {"userId": "Janne", "callCost": "0.251", "dataCost": "0.026500000000000003" }
2019-04-19 22:16:07.264  INFO 95238 --- [container-0-C-1] c.e.demo.UsageCostLoggerApplication      : {"userId": "Janne", "callCost": "0.15100000000000002", "dataCost": "0.08700000000000001" }
2019-04-19 22:16:08.263  INFO 95238 --- [container-0-C-1] c.e.demo.UsageCostLoggerApplication      : {"userId": "Sabby", "callCost": "0.10100000000000002", "dataCost": "0.33" }
2019-04
Cloud Foundry
Before registering and deploying stream applications to Cloud Foundry by using the instructions shown earlier, you should ensure that you have an instance of Spring Cloud Data Flow running on Cloud Foundry. Follow the Cloud Foundry installation guide for reference.
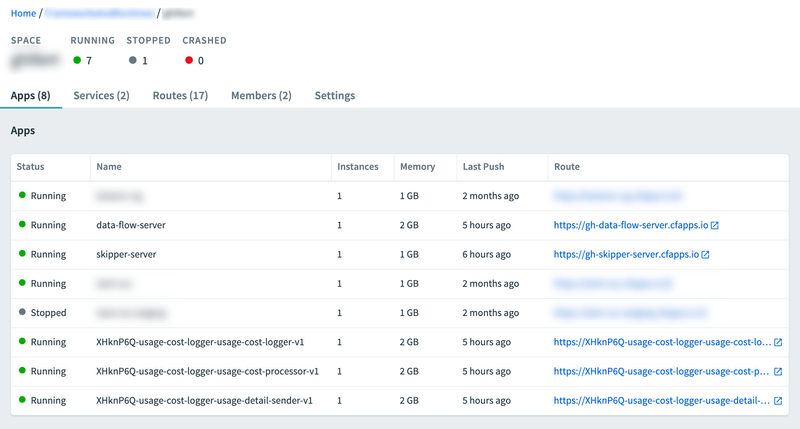
Once you have followed the steps shown earlier in this chapter and have registered the applications as well as deployed the stream, you can see the successfully deployed applications in your in your Org and Space in Cloud Foundry, as follows:
You can access the runtime information of your stream applications in the Spring Cloud Data Flow dashboard as well.
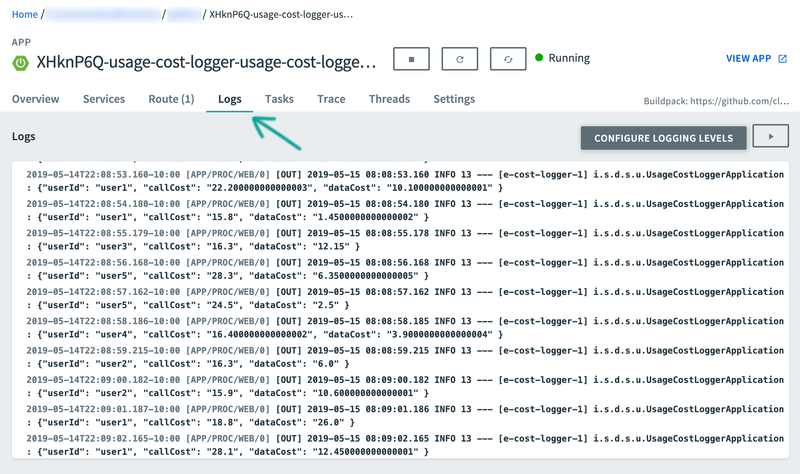
Besides verifying the runtime status of your stream, you should also verify the logging output produced by the usage-cost-logger sink. In Cloud Foundry Apps Manager, click the Logs tab of the usage-cost-logger sink application. The logging statements should look like the following:
Kubernetes
Once you have the Spring Cloud Data Flow server running in Kubernetes (by following the instructions from the installation guide), you can:
- Register the stream applications
- Create, deploy, and manage streams
Registering Applications with Spring Cloud Data Flow server
The Kubernetes environment requires the application artifacts to be docker images.
For the UsageDetailSender source, use the following:
docker://springcloudstream/usage-detail-sender-rabbit:0.0.1-SNAPSHOTFor the UsageCostProcessor processor, use the following:
docker://springcloudstream/usage-cost-processor-rabbit:0.0.1-SNAPSHOTFor the UsageCostLogger sink, use the following:
docker://springcloudstream/usage-cost-logger-rabbit:0.0.1-SNAPSHOTYou can register these applications, as described in the application registration step described earlier.
Stream Deployment
Once you have registered the applications, you can deploy the stream per the instructions from the stream deployment section above.
Listing the Pods
To lists the pods (including the server components and the streaming applications), run the following command (shown with its output):
kubectl get podsNAME READY STATUS RESTARTS AGE
scdf-release-data-flow-server-795c77b85c-tqdtx 1/1 Running 0 36m
scdf-release-data-flow-skipper-85b6568d6b-2jgcv 1/1 Running 0 36m
scdf-release-mariadb-744757b689-tsnnz 1/1 Running 0 36m
scdf-release-rabbitmq-5fb7f7f644-878pz 1/1 Running 0 36m
usage-cost-logger-usage-cost-logger-v1-568599d459-hk9b6 1/1 Running 0 2m41s
usage-cost-logger-usage-cost-processor-v1-79745cf97d-dwjpw 1/1 Running 0 2m42s
usage-cost-logger-usage-detail-sender-v1-6cd7d9d9b8-m2qf6 1/1 Running 0 2m41sVerifying the Logs
To be sure the steps in the previous sections have worked correctly, you should verify the logs. The following example (shown with its output) shows how to make sure that the values you expect appear in the logs:
kubectl logs -f usage-cost-logger-usage-cost-logger-v1-568599d459-hk9b62019-05-17 17:53:44.189 INFO 1 --- [e-cost-logger-1] i.s.d.s.u.UsageCostLoggerApplication : {"userId": "user2", "callCost": "0.7000000000000001", "dataCost": "23.950000000000003" }
2019-05-17 17:53:45.190 INFO 1 --- [e-cost-logger-1] i.s.d.s.u.UsageCostLoggerApplication : {"userId": "user4", "callCost": "2.9000000000000004", "dataCost": "10.65" }
2019-05-17 17:53:46.190 INFO 1 --- [e-cost-logger-1] i.s.d.s.u.UsageCostLoggerApplication : {"userId": "user3", "callCost": "5.2", "dataCost": "28.85" }
2019-05-17 17:53:47.192 INFO 1 --- [e-cost-logger-1] i.s.d.s.u.UsageCostLoggerApplication : {"userId": "user4", "callCost": "1.7000000000000002", "dataCost": "30.35" }Comparison with Standalone Deployment
In this section, we deployed the stream by using Spring Cloud Data Flow with the stream DSL:
usage-detail-sender | usage-cost-processor | usage-cost-loggerWhen these three applications are deployed as standalone applications, you need to set the binding properties that connect the applications to make them into a stream.
Instead, Spring Cloud Data Flow lets you deploy all three streaming applications as a single stream by taking care of the plumbing of one application to the other to form the data flow.